


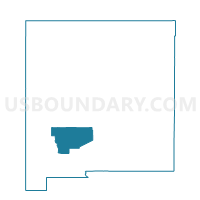
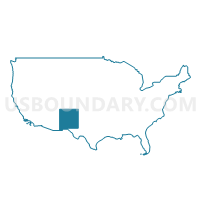
Truth or Consequences West CCD, Sierra County, New Mexico
About
Outline

Summary
| Unique Area Identifier | 142652 |
| Name | Truth or Consequences West CCD |
| County | Sierra County |
| State | New Mexico |
| Area (square miles) | 1,910.33 |
| Land Area (square miles) | 1,903.25 |
| Water Area (square miles) | 7.07 |
| % of Land Area | 99.63 |
| % of Water Area | 0.37 |
| Latitude of the Internal Point | 33.08107660 |
| Longtitude of the Internal Point | -107.58577330 |
| Total Population | 2,674 |
| Total Housing Units | 1,670 |
| Total Households | 1,196 |
| Median Age | 52.1 |
Maps

Graphs
Select a template below for downloading or customizing gragh for Truth or Consequences West CCD, Sierra County, New Mexico


Neighbors
Neighoring County Subdivision (by Name) Neighboring County Subdivision on the Map
- Bayard-Santa Rita CCD, Grant County, NM
- Deming North CCD, Luna County, NM
- Hatch CCD, Doña Ana County, NM
- Magdalena CCD, Socorro County, NM
- Mimbres CCD, Grant County, NM
- Pinos Altos CCD, Grant County, NM
- Quemado CCD, Catron County, NM
- Truth or Consequences East CCD, Sierra County, NM
Top 10 Neighboring Place (by Population) Neighboring Place on the Map
- Truth or Consequences city, NM (6,475)
- Arrey CDP, NM (232)
- Las Palomas CDP, NM (173)
- Oasis CDP, NM (149)
- Hillsboro CDP, NM (124)
- Caballo CDP, NM (112)
- Winston CDP, NM (61)
- Kingston CDP, NM (32)
Top 10 Neighboring Unified School District (by Population) Neighboring Unified School District on the Map
- Deming Public Schools, NM (25,095)
- Socorro Consolidated Schools, NM (12,352)
- Truth or Consequences Schools, NM (11,988)
- Cobre Consolidated Schools, NM (8,137)
- Hatch Valley Municipal Schools, NM (5,819)
- Magdalena Municipal Schools, NM (2,984)
- Reserve Independent Schools, NM (2,071)
Top 10 Neighboring State Legislative District Lower Chamber (by Population) Neighboring State Legislative District Lower Chamber on the Map
- State House District 49, NM (31,024)
- State House District 36, NM (28,755)
- State House District 32, NM (25,095)
- State House District 38, NM (23,451)
Top 10 Neighboring State Legislative District Upper Chamber (by Population) Neighboring State Legislative District Upper Chamber on the Map
- State Senate District 37, NM (66,562)
- State Senate District 36, NM (48,503)
- State Senate District 28, NM (43,562)
- State Senate District 35, NM (39,691)
Top 10 Neighboring 111th Congressional District (by Population) Neighboring 111th Congressional District on the Map
Top 10 Neighboring Census Tract (by Population) Neighboring Census Tract on the Map
- Census Tract 14, Doña Ana County, NM (5,719)
- Census Tract 5, Luna County, NM (4,338)
- Census Tract 9764, Catron County, NM (3,725)
- Census Tract 9623, Sierra County, NM (3,460)
- Census Tract 9646, Grant County, NM (3,060)
- Census Tract 9624.02, Sierra County, NM (2,589)
- Census Tract 9641, Grant County, NM (2,515)
- Census Tract 9624.01, Sierra County, NM (2,483)
- Census Tract 9782, Socorro County, NM (1,851)
Top 10 Neighboring 5-Digit ZIP Code Tabulation Area (by Population) Neighboring 5-Digit ZIP Code Tabulation Area on the Map
- 88030, NM (23,222)
- 87901, NM (7,139)
- 87937, NM (3,303)
- 87825, NM (2,999)
- 87935, NM (1,770)
- 88041, NM (1,243)
- 87942, NM (898)
- 87930, NM (829)
- 87931, NM (634)
- 87936, NM (515)
Data
Demographic, Population, Households, and Housing Units
** Data sources from census 2010 **
Show Data on Map
Download Full List as CSV
Download Quick Sheet as CSV
| Subject | This Area | Sierra County | New Mexico | National |
|---|---|---|---|---|
| POPULATION | ||||
| Total Population Map | 2,674 | 11,988 | 2,059,179 | 308,745,538 |
| POPULATION, HISPANIC OR LATINO ORIGIN | ||||
| Not Hispanic or Latino Map | 1,667 | 8,636 | 1,105,776 | 258,267,944 |
| Hispanic or Latino Map | 1,007 | 3,352 | 953,403 | 50,477,594 |
| POPULATION, RACE | ||||
| White alone Map | 2,151 | 10,265 | 1,407,876 | 223,553,265 |
| Black or African American alone Map | 3 | 49 | 42,550 | 38,929,319 |
| American Indian and Alaska Native alone Map | 39 | 199 | 193,222 | 2,932,248 |
| Asian alone Map | 7 | 49 | 28,208 | 14,674,252 |
| Native Hawaiian and Other Pacific Islander alone Map | 0 | 3 | 1,810 | 540,013 |
| Some Other Race alone Map | 392 | 1,032 | 308,503 | 19,107,368 |
| Two or More Races Map | 82 | 391 | 77,010 | 9,009,073 |
| POPULATION, SEX | ||||
| Male Map | 1,390 | 6,027 | 1,017,421 | 151,781,326 |
| Female Map | 1,284 | 5,961 | 1,041,758 | 156,964,212 |
| POPULATION, AGE (18 YEARS) | ||||
| 18 years and over Map | 2,156 | 10,060 | 1,540,507 | 234,564,071 |
| Under 18 years | 518 | 1,928 | 518,672 | 74,181,467 |
| POPULATION, AGE | ||||
| Under 5 years | 115 | 568 | 144,981 | 20,201,362 |
| 5 to 9 years | 128 | 484 | 143,308 | 20,348,657 |
| 10 to 14 years | 156 | 535 | 141,691 | 20,677,194 |
| 15 to 17 years | 119 | 341 | 88,692 | 12,954,254 |
| 18 and 19 years | 52 | 199 | 61,169 | 9,086,089 |
| 20 years | 22 | 104 | 29,935 | 4,519,129 |
| 21 years | 18 | 89 | 28,237 | 4,354,294 |
| 22 to 24 years | 57 | 289 | 84,198 | 12,712,576 |
| 25 to 29 years | 61 | 456 | 139,678 | 21,101,849 |
| 30 to 34 years | 84 | 352 | 127,567 | 19,962,099 |
| 35 to 39 years | 117 | 440 | 123,303 | 20,179,642 |
| 40 to 44 years | 163 | 583 | 125,220 | 20,890,964 |
| 45 to 49 years | 157 | 758 | 144,839 | 22,708,591 |
| 50 to 54 years | 224 | 894 | 147,170 | 22,298,125 |
| 55 to 59 years | 252 | 1,086 | 136,799 | 19,664,805 |
| 60 and 61 years | 81 | 434 | 51,238 | 7,113,727 |
| 62 to 64 years | 170 | 702 | 68,899 | 9,704,197 |
| 65 and 66 years | 98 | 446 | 37,921 | 5,319,902 |
| 67 to 69 years | 150 | 645 | 49,969 | 7,115,361 |
| 70 to 74 years | 188 | 923 | 65,904 | 9,278,166 |
| 75 to 79 years | 134 | 719 | 50,230 | 7,317,795 |
| 80 to 84 years | 73 | 519 | 36,238 | 5,743,327 |
| 85 years and over | 55 | 422 | 31,993 | 5,493,433 |
| MEDIAN AGE BY SEX | ||||
| Both sexes Map | 52.10 | 54.50 | 36.70 | 37.20 |
| Male Map | 52.50 | 54.30 | 35.30 | 35.80 |
| Female Map | 51.70 | 54.70 | 38.00 | 38.50 |
| HOUSEHOLDS | ||||
| Total Households Map | 1,196 | 5,917 | 791,395 | 116,716,292 |
| HOUSEHOLDS, HOUSEHOLD TYPE | ||||
| Family households: Map | 752 | 3,126 | 518,698 | 77,538,296 |
| Husband-wife family Map | 621 | 2,368 | 358,354 | 56,510,377 |
| Other family: Map | 131 | 758 | 160,344 | 21,027,919 |
| Male householder, no wife present Map | 48 | 229 | 49,408 | 5,777,570 |
| Female householder, no husband present Map | 83 | 529 | 110,936 | 15,250,349 |
| Nonfamily households: Map | 444 | 2,791 | 272,697 | 39,177,996 |
| Householder living alone Map | 381 | 2,413 | 221,347 | 31,204,909 |
| Householder not living alone Map | 63 | 378 | 51,350 | 7,973,087 |
| HOUSEHOLDS, HISPANIC OR LATINO ORIGIN OF HOUSEHOLDER | ||||
| Not Hispanic or Latino householder: Map | 862 | 4,697 | 477,947 | 103,254,926 |
| Hispanic or Latino householder: Map | 334 | 1,220 | 313,448 | 13,461,366 |
| HOUSEHOLDS, RACE OF HOUSEHOLDER | ||||
| Householder who is White alone | 1,005 | 5,247 | 583,668 | 89,754,352 |
| Householder who is Black or African American alone | 1 | 18 | 16,087 | 14,129,983 |
| Householder who is American Indian and Alaska Native alone | 24 | 96 | 56,494 | 939,707 |
| Householder who is Asian alone | 2 | 24 | 9,573 | 4,632,164 |
| Householder who is Native Hawaiian and Other Pacific Islander alone | 0 | 2 | 597 | 143,932 |
| Householder who is Some Other Race alone | 129 | 353 | 102,631 | 4,916,427 |
| Householder who is Two or More Races | 35 | 177 | 22,345 | 2,199,727 |
| HOUSEHOLDS, HOUSEHOLD TYPE BY HOUSEHOLD SIZE | ||||
| Family households: Map | 752 | 3,126 | 518,698 | 77,538,296 |
| 2-person household Map | 430 | 1,961 | 216,503 | 31,882,616 |
| 3-person household Map | 136 | 565 | 116,153 | 17,765,829 |
| 4-person household Map | 92 | 302 | 96,379 | 15,214,075 |
| 5-person household Map | 55 | 189 | 52,499 | 7,411,997 |
| 6-person household Map | 30 | 70 | 21,714 | 3,026,278 |
| 7-or-more-person household Map | 9 | 39 | 15,450 | 2,237,501 |
| Nonfamily households: Map | 444 | 2,791 | 272,697 | 39,177,996 |
| 1-person household Map | 381 | 2,413 | 221,347 | 31,204,909 |
| 2-person household Map | 58 | 337 | 43,741 | 6,360,012 |
| 3-person household Map | 3 | 26 | 5,199 | 992,156 |
| 4-person household Map | 1 | 10 | 1,662 | 411,171 |
| 5-person household Map | 1 | 5 | 498 | 126,634 |
| 6-person household Map | 0 | 0 | 131 | 48,421 |
| 7-or-more-person household Map | 0 | 0 | 119 | 34,693 |
| HOUSING UNITS | ||||
| Total Housing Units Map | 1,670 | 8,356 | 901,388 | 131,704,730 |
| HOUSING UNITS, OCCUPANCY STATUS | ||||
| Occupied Map | 1,196 | 5,917 | 791,395 | 116,716,292 |
| Vacant Map | 474 | 2,439 | 109,993 | 14,988,438 |
| HOUSING UNITS, OCCUPIED, TENURE | ||||
| Owned with a mortgage or a loan Map | 396 | 1,819 | 337,570 | 52,979,430 |
| Owned free and clear Map | 602 | 2,463 | 204,552 | 23,006,644 |
| Renter occupied Map | 198 | 1,635 | 249,273 | 40,730,218 |
| HOUSING UNITS, VACANT, VACANCY STATUS | ||||
| For rent Map | 23 | 327 | 22,150 | 4,137,567 |
| Rented, not occupied Map | 2 | 7 | 1,303 | 206,825 |
| For sale only Map | 18 | 166 | 11,050 | 1,896,796 |
| Sold, not occupied Map | 8 | 23 | 2,143 | 421,032 |
| For seasonal, recreational, or occasional use Map | 271 | 1,326 | 36,612 | 4,649,298 |
| For migrant workers Map | 1 | 1 | 229 | 24,161 |
| Other vacant Map | 151 | 589 | 36,506 | 3,652,759 |
| HOUSING UNITS, OCCUPIED, AVERAGE HOUSEHOLD SIZE BY TENURE | ||||
| Total: Map | 2.24 | 1.98 | 2.55 | 2.58 |
| Owner occupied Map | 2.25 | 1.96 | 2.60 | 2.65 |
| Renter occupied Map | 2.16 | 2.02 | 2.43 | 2.44 |
| HOUSING UNITS, OCCUPIED, TENURE BY RACE OF HOUSEHOLDER | ||||
| Owner occupied: Map | 998 | 4,282 | 542,122 | 75,986,074 |
| Householder who is White alone Map | 854 | 3,853 | 414,357 | 63,446,275 |
| Householder who is Black or African American alone Map | 1 | 6 | 7,303 | 6,261,464 |
| Householder who is American Indian and Alaska Native alone Map | 16 | 59 | 36,654 | 509,588 |
| Householder who is Asian alone Map | 1 | 12 | 5,668 | 2,688,861 |
| Householder who is Native Hawaiian and Other Pacific Islander alone Map | 0 | 1 | 307 | 61,911 |
| Householder who is Some Other Race alone Map | 98 | 233 | 64,703 | 1,975,817 |
| Householder who is Two or More Races Map | 28 | 118 | 13,130 | 1,042,158 |
| Renter occupied: Map | 198 | 1,635 | 249,273 | 40,730,218 |
| Householder who is White alone Map | 151 | 1,394 | 169,311 | 26,308,077 |
| Householder who is Black or African American alone Map | 0 | 12 | 8,784 | 7,868,519 |
| Householder who is American Indian and Alaska Native alone Map | 8 | 37 | 19,840 | 430,119 |
| Householder who is Asian alone Map | 1 | 12 | 3,905 | 1,943,303 |
| Householder who is Native Hawaiian and Other Pacific Islander alone Map | 0 | 1 | 290 | 82,021 |
| Householder who is Some Other Race alone Map | 31 | 120 | 37,928 | 2,940,610 |
| Householder who is Two or More Races Map | 7 | 59 | 9,215 | 1,157,569 |
| HOUSING UNITS, OCCUPIED, TENURE BY HISPANIC OR LATINO ORIGIN OF HOUSEHOLDER | ||||
| Owner occupied: Map | 998 | 4,282 | 542,122 | 75,986,074 |
| Not Hispanic or Latino householder Map | 744 | 3,450 | 334,598 | 69,617,625 |
| Hispanic or Latino householder Map | 254 | 832 | 207,524 | 6,368,449 |
| Renter occupied: Map | 198 | 1,635 | 249,273 | 40,730,218 |
| Not Hispanic or Latino householder Map | 118 | 1,247 | 143,349 | 33,637,301 |
| Hispanic or Latino householder Map | 80 | 388 | 105,924 | 7,092,917 |
| HOUSING UNITS, OCCUPIED, TENURE BY HOUSEHOLD SIZE | ||||
| Owner occupied: Map | 998 | 4,282 | 542,122 | 75,986,074 |
| 1-person household Map | 294 | 1,596 | 129,376 | 16,453,569 |
| 2-person household Map | 436 | 1,905 | 197,623 | 27,618,605 |
| 3-person household Map | 113 | 401 | 83,241 | 12,517,563 |
| 4-person household Map | 74 | 193 | 69,174 | 10,998,793 |
| 5-person household Map | 48 | 120 | 36,671 | 5,057,765 |
| 6-person household Map | 25 | 45 | 15,045 | 1,965,796 |
| 7-or-more-person household Map | 8 | 22 | 10,992 | 1,373,983 |
| Renter occupied: Map | 198 | 1,635 | 249,273 | 40,730,218 |
| 1-person household Map | 87 | 817 | 91,971 | 14,751,340 |
| 2-person household Map | 52 | 393 | 62,621 | 10,624,023 |
| 3-person household Map | 26 | 190 | 38,111 | 6,240,422 |
| 4-person household Map | 19 | 119 | 28,867 | 4,626,453 |
| 5-person household Map | 8 | 74 | 16,326 | 2,480,866 |
| 6-person household Map | 5 | 25 | 6,800 | 1,108,903 |
| 7-or-more-person household Map | 1 | 17 | 4,577 | 898,211 |
Loading...